

Aerospace and defense company Raytheon (NYSE:RTX) reported Q4 CY2025 results beating Wall Street’s revenue expectations, with sales up 12.1% year on year to $24.24 billion. The company expects the full year’s revenue to be around $92.5 billion, close to analysts’ estimates. Its non-GAAP profit of $1.55 per share was 5.3% above analysts’ consensus estimates.
Is now the time to buy RTX? Find out by accessing our full research report, it’s free.
RTX (RTX) Q4 CY2025 Highlights:
- Revenue: $24.24 billion vs analyst estimates of $22.65 billion (12.1% year-on-year growth, 7% beat)
- Adjusted EPS: $1.55 vs analyst estimates of $1.47 (5.3% beat)
- Adjusted EBITDA: $3.94 billion vs analyst estimates of $3.59 billion (16.2% margin, 9.6% beat)
- Adjusted EPS guidance for the upcoming financial year 2026 is $6.70 at the midpoint, in line with analyst estimates
- Operating Margin: 10.7%, in line with the same quarter last year
- Free Cash Flow Margin: 13.2%, up from 2.3% in the same quarter last year
- Organic Revenue rose 14% year on year (beat)
- Market Capitalization: $260.3 billion
"RTX delivered strong sales, adjusted EPS* and free cash flow* in 2025, enabled by our continued focus on operational performance and execution," said RTX Chairman and CEO Chris Calio.
Company Overview
Originally focused on refrigeration technology, Raytheon (NSYE:RTX) provides a a variety of products and services to the aerospace and defense industries.
Revenue Growth
A company’s long-term sales performance can indicate its overall quality. Any business can put up a good quarter or two, but many enduring ones grow for years. Unfortunately, RTX’s 6.5% annualized revenue growth over the last five years was mediocre. This was below our standard for the industrials sector and is a rough starting point for our analysis.
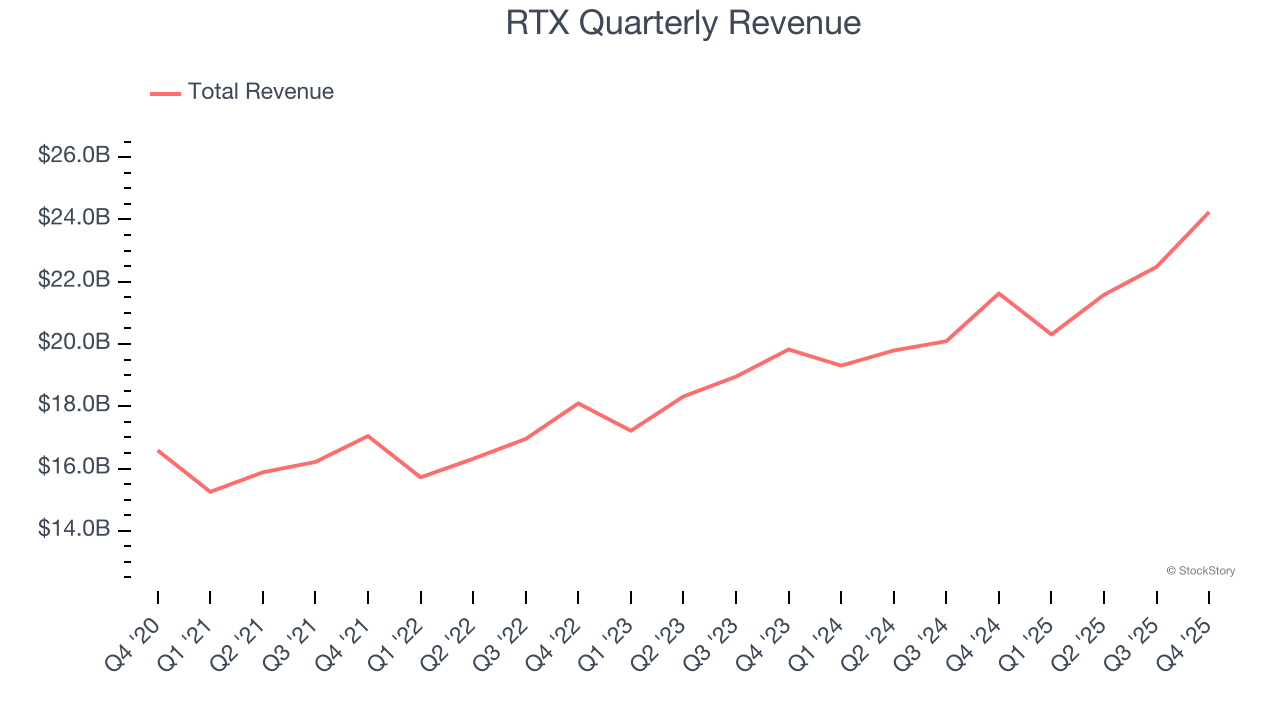
Long-term growth is the most important, but within industrials, a half-decade historical view may miss new industry trends or demand cycles. RTX’s annualized revenue growth of 9.2% over the last two years is above its five-year trend, suggesting its demand recently accelerated. 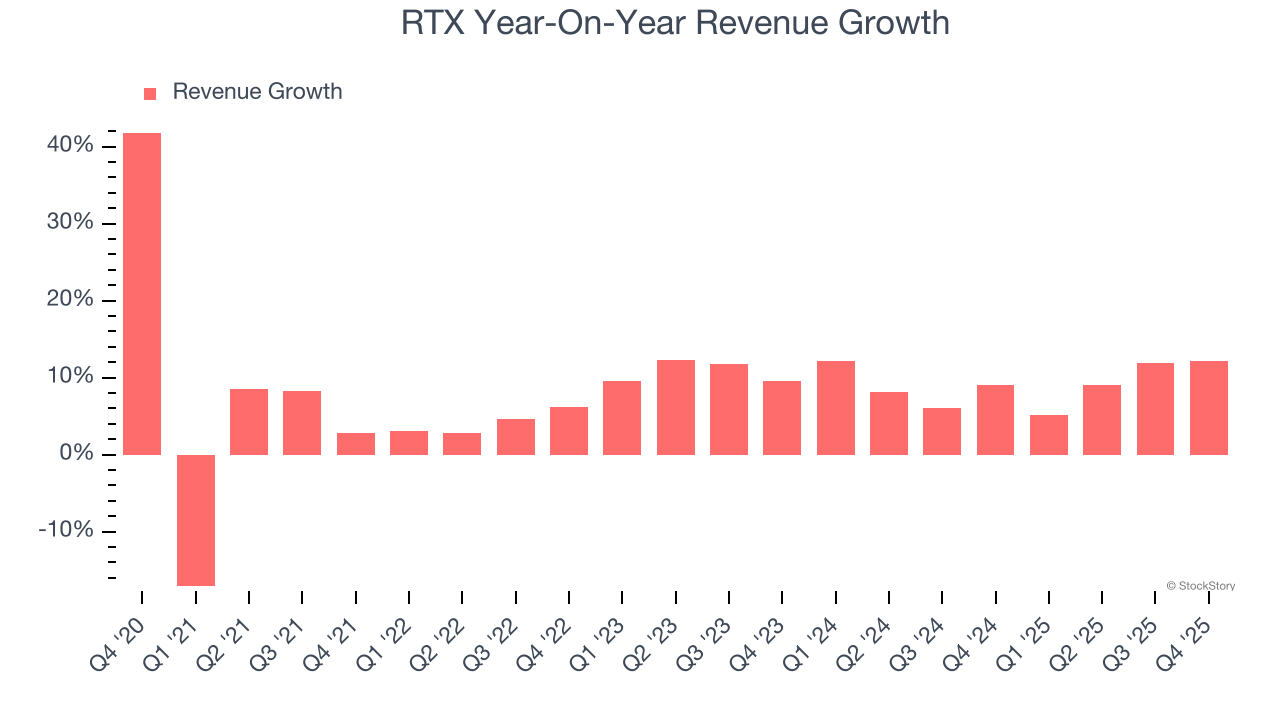
We can better understand the company’s sales dynamics by analyzing its organic revenue, which strips out one-time events like acquisitions and currency fluctuations that don’t accurately reflect its fundamentals. Over the last two years, RTX’s organic revenue averaged 12.5% year-on-year growth. Because this number is better than its two-year revenue growth, we can see that some mixture of divestitures and foreign exchange rates dampened its headline results. 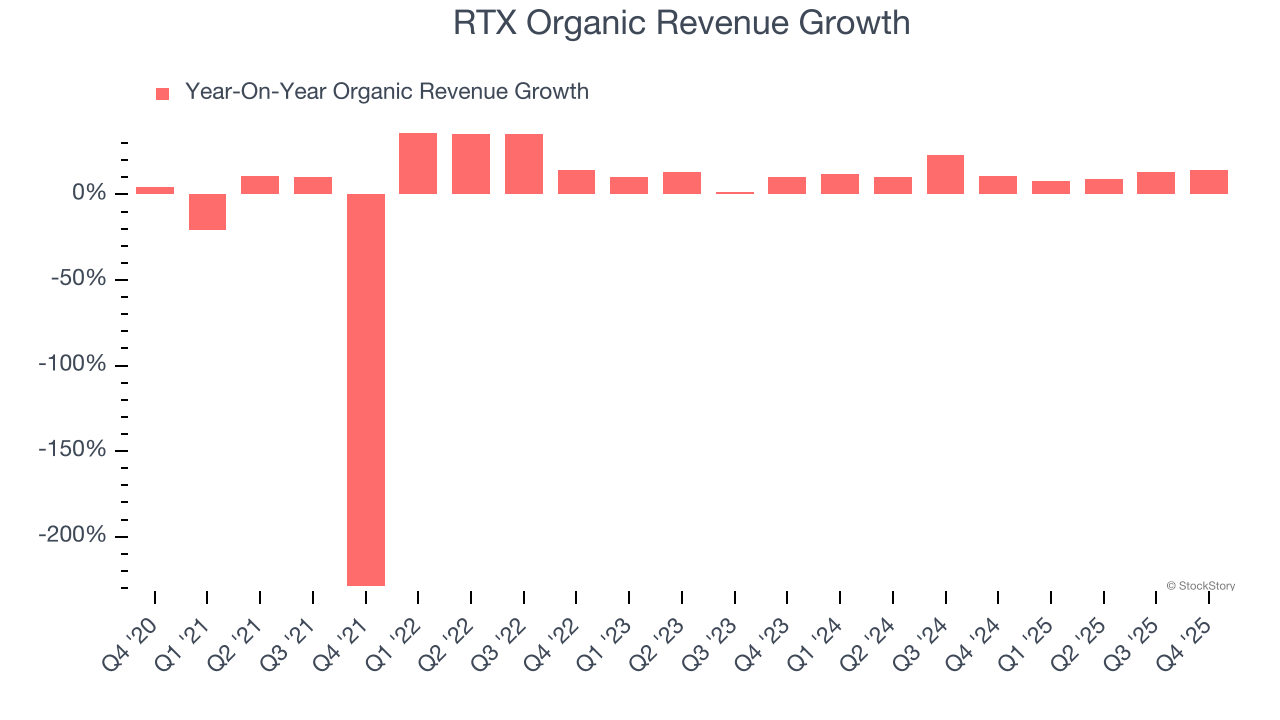
This quarter, RTX reported year-on-year revenue growth of 12.1%, and its $24.24 billion of revenue exceeded Wall Street’s estimates by 7%.
Looking ahead, sell-side analysts expect revenue to grow 4.6% over the next 12 months, a deceleration versus the last two years. This projection is underwhelming and indicates its products and services will face some demand challenges.
The 1999 book Gorilla Game predicted Microsoft and Apple would dominate tech before it happened. Its thesis? Identify the platform winners early. Today, enterprise software companies embedding generative AI are becoming the new gorillas. a profitable, fast-growing enterprise software stock that is already riding the automation wave and looking to catch the generative AI next.
Operating Margin
Operating margin is an important measure of profitability as it shows the portion of revenue left after accounting for all core expenses – everything from the cost of goods sold to advertising and wages. It’s also useful for comparing profitability across companies with different levels of debt and tax rates because it excludes interest and taxes.
RTX was profitable over the last five years but held back by its large cost base. Its average operating margin of 8% was weak for an industrials business.
On the plus side, RTX’s operating margin rose by 2.8 percentage points over the last five years, as its sales growth gave it operating leverage.
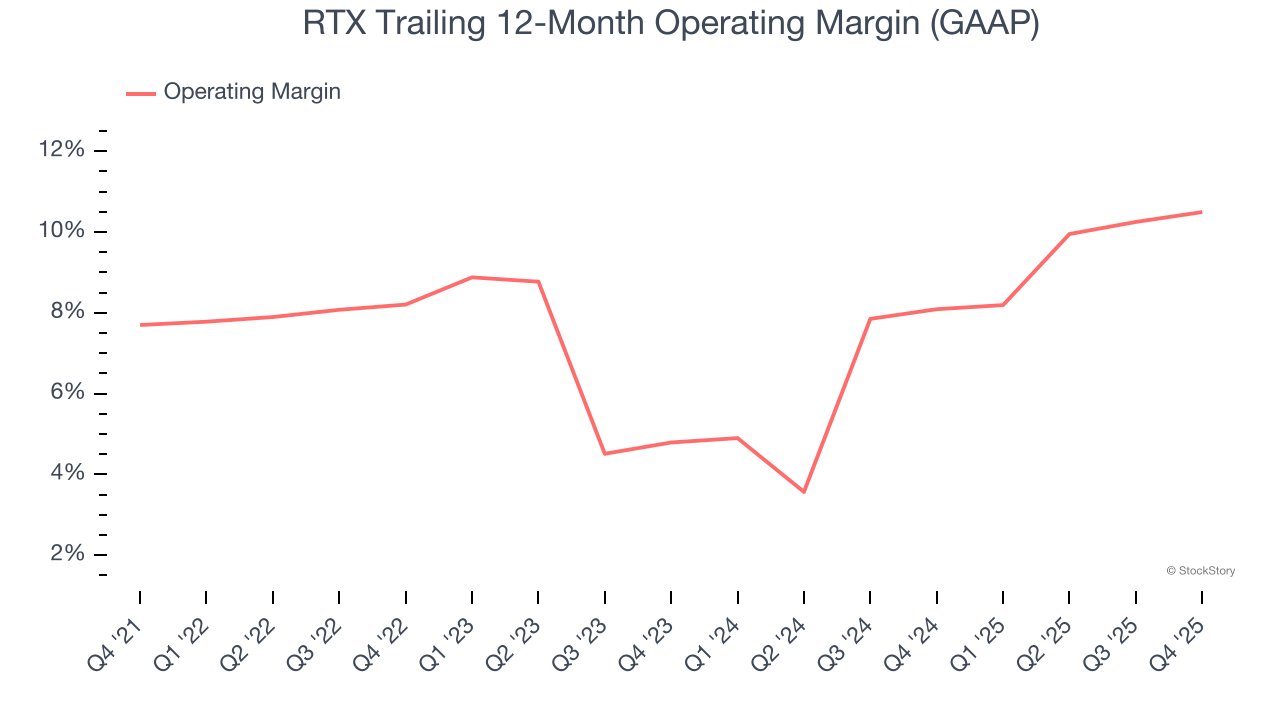
In Q4, RTX generated an operating margin profit margin of 10.7%, in line with the same quarter last year. This indicates the company’s overall cost structure has been relatively stable.
Earnings Per Share
We track the long-term change in earnings per share (EPS) for the same reason as long-term revenue growth. Compared to revenue, however, EPS highlights whether a company’s growth is profitable.
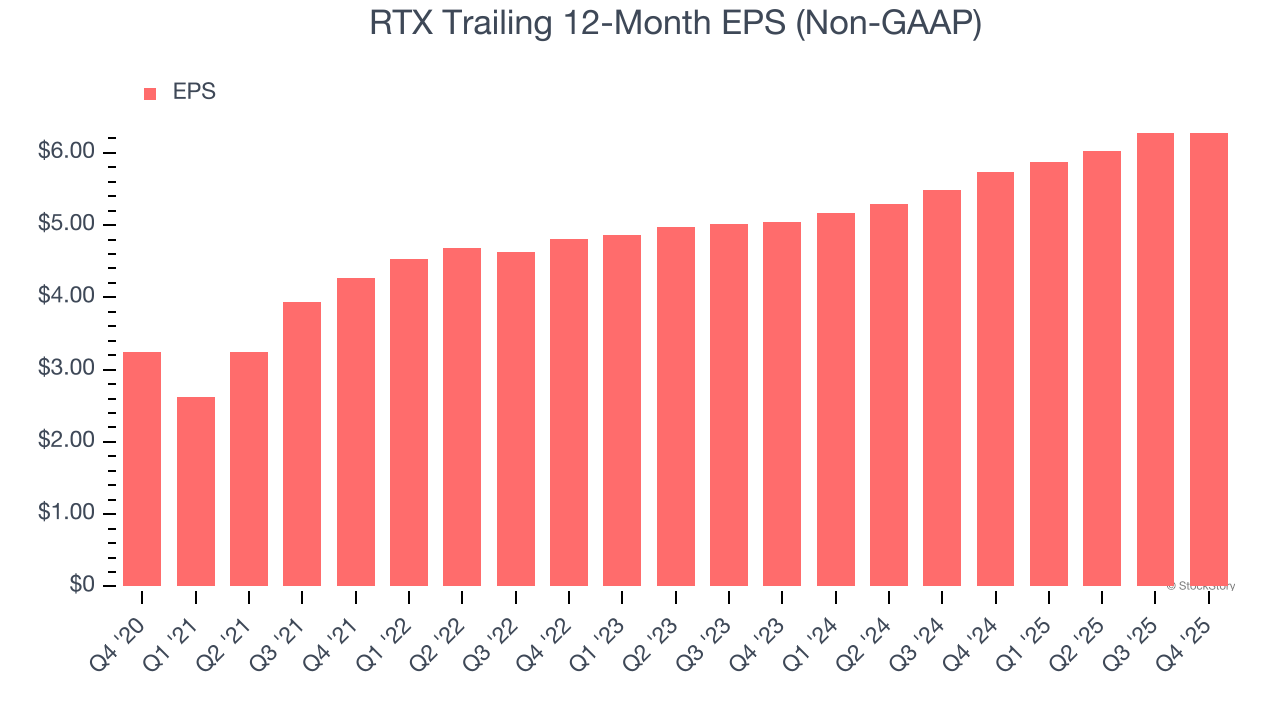
RTX’s EPS grew at a remarkable 14.2% compounded annual growth rate over the last five years, higher than its 6.5% annualized revenue growth. This tells us the company became more profitable on a per-share basis as it expanded.
We can take a deeper look into RTX’s earnings to better understand the drivers of its performance. As we mentioned earlier, RTX’s operating margin was flat this quarter but expanded by 2.8 percentage points over the last five years. On top of that, its share count shrank by 10.1%. These are positive signs for shareholders because improving profitability and share buybacks turbocharge EPS growth relative to revenue growth. 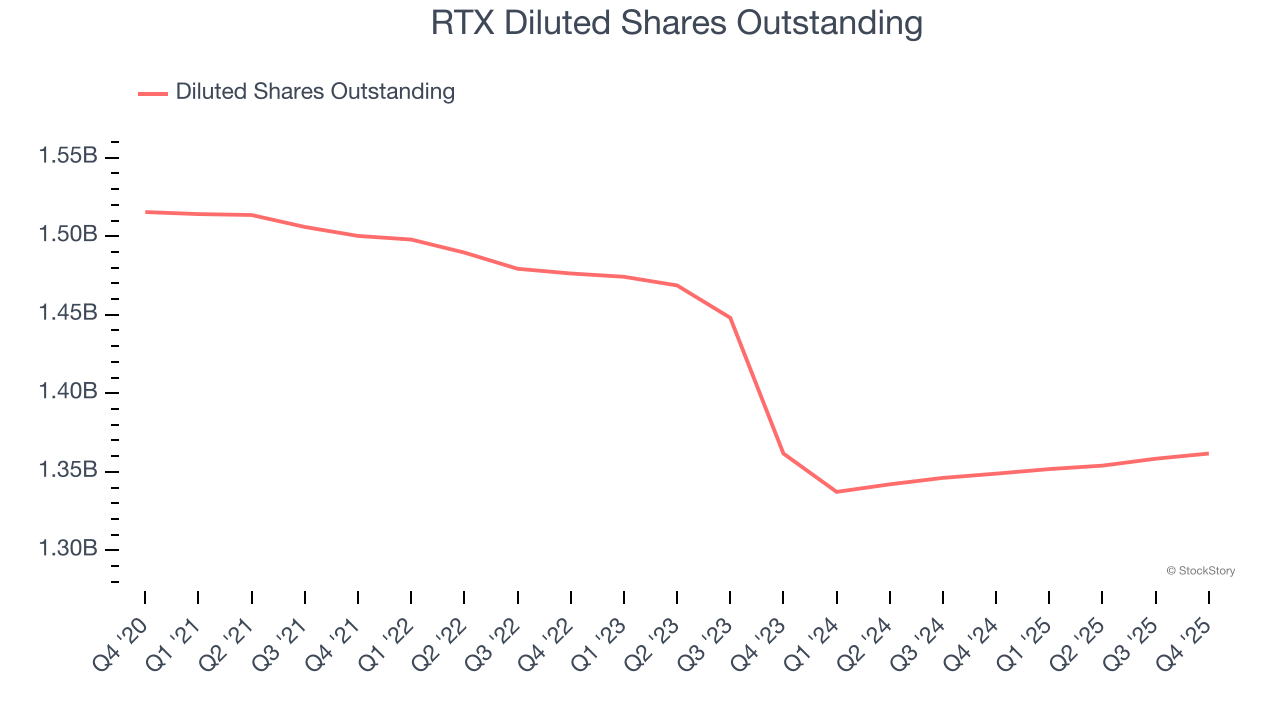
Like with revenue, we analyze EPS over a more recent period because it can provide insight into an emerging theme or development for the business.
For RTX, its two-year annual EPS growth of 11.6% was lower than its five-year trend. We still think its growth was good and hope it can accelerate in the future.
In Q4, RTX reported adjusted EPS of $1.55, up from $1.54 in the same quarter last year. This print beat analysts’ estimates by 5.3%. Over the next 12 months, Wall Street expects RTX’s full-year EPS of $6.28 to grow 7.2%.
Key Takeaways from RTX’s Q4 Results
We were impressed by how significantly RTX blew past analysts’ organic revenue expectations this quarter. We were also excited its EBITDA outperformed Wall Street’s estimates by a wide margin. Zooming out, we think this was a solid print. The stock traded up 3.3% to $200.47 immediately following the results.
RTX put up rock-solid earnings, but one quarter doesn’t necessarily make the stock a buy. Let’s see if this is a good investment. When making that decision, it’s important to consider its valuation, business qualities, as well as what has happened in the latest quarter. We cover that in our actionable full research report which you can read here (it’s free).